During my internship at Saral Startup School, I worked on their production website built with Next.js and Tailwind CSS. One of the key challenges I faced — and learned the most from — was improving the site's Core Web Vitals: LCP (Largest Contentful Paint), CLS (Cumulative Layout Shift), and INP (Interaction to Next Paint).
In this blog, I'll walk you through how I approached this problem, the tools I used, the fixes I applied, and the final results we achieved. If you're a developer working with Next.js or any frontend-heavy site, this might help you avoid some common pitfalls!
Why Core Web Vitals Matter
Core Web Vitals are a set of performance signals that measure real-world user experience. They play a major role in SEO, page speed, and overall usability.
The three key metrics:
-
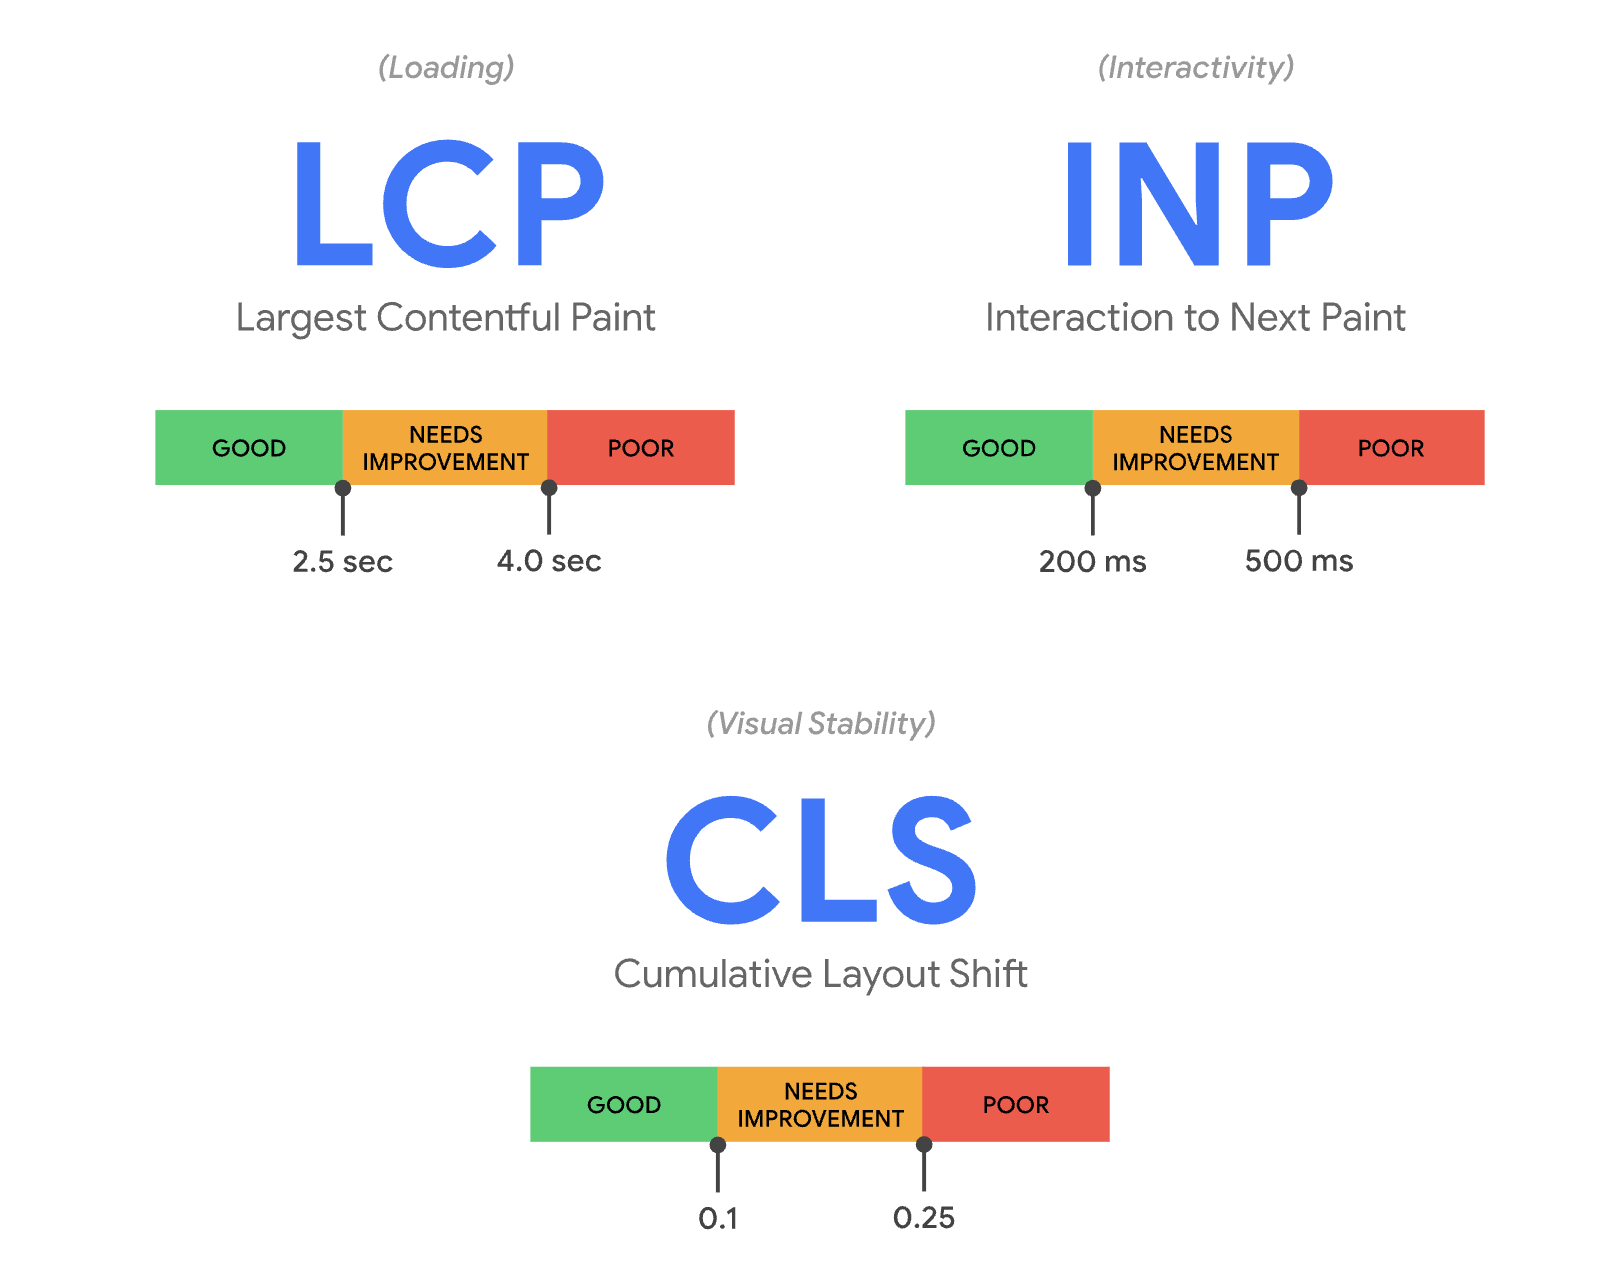
LCP (Largest Contentful Paint): Measures how long it takes the largest element (often a hero image or heading) to load.
-
CLS (Cumulative Layout Shift): Measures unexpected layout movements during page load.
-
INP (Interaction to Next Paint): Measures responsiveness during user interaction.
When I joined Saral Startup School as a Web Developer Intern, one of my early tasks was to improve the performance and SEO of the landing page. The initial web vitals scores weren't horrible — but definitely not good enough for a great user experience.
Initial Metrics (Before Optimization)
We used PageSpeed Insights and Chrome Lighthouse for auditing. Here's what the initial scores looked like:
| Metric | Value (Mobile) | Status |
|---|---|---|
| LCP | 4.5s | Needs Improvement |
| CLS | 0.23s | Needs Improvement |
| INP | 380ms | Poor |
These were dragging down the site's performance grade, and the experience on slower devices felt clunky and sluggish.
The Audit Process
To start, I:
-
Ran Lighthouse audits on all key pages.
-
Installed the Web Vitals Chrome extension to track metrics in real-time.
-
Identified blocking scripts, unoptimized images, layout shifts, and unnecessary re-renders.
-
Inspected large components in DevTools and studied the React profiler for sluggish state updates.
Here's what I found:
-
LCP was delayed due to large images and unused render-blocking CSS.
-
CLS came from images and embeds without width/height attributes and dynamic sections like banners loading late.
-
INP was caused by large JS bundles and some components triggering heavy re-renders on input.
Fixes I Implemented
Fixing LCP
-
Replaced
<img>tags with Next.jsImagecomponent withpriority={true}for the hero banner. -
Used optimized image formats
(webp)and served from Vercel CDN. -
Removed unused CSS via Tailwind's purge feature.
-
Deprioritized third-party fonts and loaded critical fonts inline.
Fixing CLS
-
Explicitly defined
widthandheightattributes on all images and iframes. -
Reserved space for components that load async (like newsletter banners).
-
Applied
font-display: swapto Google Fonts to prevent layout jank. -
Delayed the loading of non-critical UI elements like animations.
Fixing INP
-
Code-splitting: Used
React.lazy()and dynamic imports for large components. -
Debounced input fields that triggered expensive state updates.
-
Reduced unnecessary DOM updates in dropdowns, menus, and modals.
-
Removed unused JavaScript and replaced bulky dependencies with lighter alternatives.
Final Results (After Optimization)
After pushing these fixes, here's what our updated metrics looked like on the same page:
| Metric | Value (Mobile) | Status |
|---|---|---|
| LCP | 1.9s | Good |
| CLS | 0.03s | Good |
| INP | 145ms | Good |
The performance score on Lighthouse jumped from 68 → 92, and users on lower-end devices reported smoother interactions. Page load felt significantly faster, and even Google Search Console reflected improved Core Web Vitals coverage.
What I Learned
-
Optimizing performance is not about hacks — it's about understanding the browser render pipeline.
-
Fixing layout shifts is often as simple as being explicit with sizes and spacing.
-
Even small refactors like lazy-loading non-essential components can make a huge difference.
-
Debugging performance is like detective work — tools like Lighthouse, WebPageTest, and React Profiler are your best friends.
-
Some other key optimization includes:
- Server-Side Rendering (SSR)
- Static Side Generation (SSG)
- Image Optimization
- Prefetching Routes
And above all, I realized that measuring is just as important as building. You can't improve what you don't track.
Final Thoughts
If you're working on a production website, especially with a framework like Next.js, you need to think about performance from day one. Core Web Vitals aren't just for SEO — they define how your product feels.
During my time at Saral Startup School, this task helped me grow immensely as a frontend developer, and I'm proud to say I shipped a faster, more usable product.